import numpy as np
from imageio import imread
import matplotlib.pyplot as plt
from scipy.signal import convolve2d

car = imread("../images/car.png", as_gray=True)
F = np.fft.fft(car[100])
M = len(F)
N = len(car)
sinus = lambda i, u: np.sin(2*np.pi*u*i/M)
cosinus = lambda i, u: np.cos(2*np.pi*u*i/M)

## Obs: Koden er for illustrasjon, og kan inneholde bugs
#
def erosjon(f, S):
    n,m = S.shape
    N,M = f.shape
    padded = np.pad(f, (n//2, m//2), mode="constant")
    ut = np.ones(f.shape)
    hit = np.sum(np.sum(S))

    for x in range(0, N):
        for y in range(0, M):
            i = 0; j = 0
            while i < n and j < m and ut[x,y] == 1:
                if S[i,j] == 1 and padded[x+i,y+j] == 0:
                    ut[x,y] = 0
                j += 1
                if j == m:
                    i += 1
                    j = 0

    return ut

## Obs: Koden er for illustrasjon, og kan inneholde bugs
#
def dilatasjon(f, S):
    n,m = S.shape
    N,M = f.shape
    padded = np.pad(f, (n//2, m//2))
    ut = np.zeros(f.shape)

    for x in range(0, N):
        for y in range(0, M):
            res = padded[x:x+n,y:y+m] * S
            ut[x,y] = 1 if np.sum(np.sum(res)) >= 1 else 0
    return ut
Litt om forrige forelesning
Det som skal skje:
- Fourier analyse eksempel
- Konvolusjonsteoremet
- Eksempel: Høypass
- Morfologi
- Operatorene
- Hit-or-miss eksempel
Forrige gang lærte vi HVA Fourier er
DFT: $$ F(u,v) = \sum_{x=0}^{M-1} \sum_{y=0}^{N-1} f(x,y) * e^{-2 \pi j ( \frac{ux}{M} + \frac{vy}{N} )} $$ Invers DFT: $$ f(x,y) = \frac{1}{M N} \sum_{u=0}^{M-1} \sum_{v=0}^{N-1} F(u,v) e^{2 \pi j ( \frac{ux}{M} + \frac{vy}{N} )} $$
Eller, sagt på en annen måte:
$ f = \sum_{u=0}^{M} \sum_{v=0}^{N} A_{cos} *$

+ $ A_{sin}$$* $

$ F(u,v) = sum \Big($

*

$\Big), sum \Big($

*

$\Big)$
Denne gangen: Hva vi kan BRUKE den til
... i INF2310. Fourier dukker opp over alt
Analyse eksempel: Bilineær Stalone
Bilder handler mye om frekvenser, og i INF2310 kan vi koble dette til
- Rayleighs teorem, og Nyquist
- Kantdeteksjon
- Støyreduksjon
- Med mer
Det er derfor fint å ha en måte å kunne analysere frekvenser i en matrise (bilde/filter).
Eksempel
I oblig 1 så vi på Sylvester Stalone, og en resampling av ham. Den bilineære Stalone er veldig blurry:

Om vi ser på Fourier spekteret for originalen versus den bilineære:
stal = imread("portrett.png", as_gray=True)
bi_stal = imread("bilinear_stalone.png", as_gray=True)

fft_stal = np.fft.fftshift(np.fft.fft2(stal))
fft_bi = np.fft.fftshift(np.fft.fft2(bi_stal))

for x in range(fft_stal.shape[1]):
    for y in range(fft_stal.shape[0]):
        if abs(fft_stal[y,x]) < 150: fft_stal[y,x] = 0 # Setter lavere bidrag til 0 for å illustrere

for x in range(fft_bi.shape[1]):
    for y in range(fft_bi.shape[0]):
        if abs(fft_bi[y,x]) < 150: fft_bi[y,x] = 0 # Setter lavere bidrag til 0 for å illustrere

fig, _ = plt.subplots(1, 1, figsize = (20, 18)); fig.add_subplot(2,2,1); plt.imshow(stal, cmap="gray"); fig.add_subplot(2,2,2); plt.imshow(bi_stal, cmap="gray"); fig.add_subplot(2,2,3); plt.imshow(np.log(np.abs(fft_stal)+1)); fig.add_subplot(2,2,4); plt.imshow(np.log(np.abs(fft_bi)+1))
kan vi analysere at vi ikke har fått noen flere frekvenser ved resampling (som forventet). Bildet ser blurry ut fordi vi mangler høye frekvenser, men har forsøkt å fylle igjen pikslene likevel.
Konvolusjonsteoremet
$$ f * h = fourier^{-1}(F \odot H) $$... ish. Det er en grunn til at regelen er skrevet mer presist i slidsene, og det kommer dere til å få sett i oblig 2.
Eksempel: Høypass
Jeg vil høypassfiltrere car.png. Da tenker jeg at vi bør gjøre en konvolusjon med et Laplace filter:
laplace = np.array([[-1, -1, -1],
                    [-1, 8, -1],
                    [-1, -1, -1]])
plt.imshow(laplace, cmap="plasma")
car_high_conv = convolve2d(car, laplace, "same", "wrap")
car_high_conv_fft = np.fft.fftshift(np.fft.fft2(car_high_conv))

f, ax = plt.subplots(1, 1, figsize = (20, 10)); f.add_subplot(1,2,1); plt.imshow(car_high_conv, cmap="gray"); f.add_subplot(1,2,2); plt.imshow(np.abs(car_high_conv_fft))
Flott, men vi ville se om vi kunne gjøre det via konvolusjonsteoremet!
Vi vet at Fourier av car og laplace multiplisert med hverandre burde gi det samme som dette, så la oss prøve. Først, fft av laplace:
lap_fft = np.fft.fft2(laplace)
car_fft = np.fft.fft2(car)

f, ax = plt.subplots(1, 1, figsize = (20, 10)); f.add_subplot(1,2,1); plt.imshow(np.log(1+np.abs(np.fft.fftshift(car_fft)))) ;f.add_subplot(1,2,2); plt.imshow(np.abs(np.fft.fftshift(lap_fft)), cmap="plasma")
Her vil ikke dimensjonene fungere, H bildet er for lite. Vi må padde h:
padded = np.zeros((N,M))
for i in range(laplace.shape[0]):
    for j in range(laplace.shape[1]):
        padded[i,j] = laplace[i,j]
lap_fft_pad = np.fft.fft2(laplace, (N, M))
resultat = car_fft*lap_fft_pad

f, ax = plt.subplots(1, 1, figsize = (20, 15)); f.add_subplot(2,3,1) ; plt.imshow(np.log(1+np.abs(np.fft.fftshift(car_fft)))); plt.title("F = fft(f)"); f.add_subplot(2,3,2); plt.imshow(np.log(1+np.abs(np.fft.fftshift(lap_fft_pad))), cmap="plasma"); plt.title("H = fft(padded(h))"); f.add_subplot(2,3,3); plt.imshow(np.abs(np.fft.fftshift(resultat))); plt.title("Resultat"); f.add_subplot(2,3,4); plt.imshow(car, cmap="gray"); plt.title("f"); f.add_subplot(2,3,5); plt.imshow(padded, cmap="gray"); plt.title("padded(h)"); f.add_subplot(2,3,6); plt.imshow(np.real(np.fft.ifft2(resultat)), cmap="gray"); plt.title("ifft(Resultat)")
Nå kan dere
- Designe filtre i frekvensdomenet
- Analysere filtre
- Gjøre konvolusjon i konstant tid (for en gitt bildestørrelse)
Morfologi
Vi jobber med binære bilder. 0 til 255 er nå 0 eller 1. Morfologi kan tenkes på som filtrering slik dere kjenner det, men med bare to filtre: Erosjon og dilatasjon
Erosjon
Vi sier bilde f erodert med naboskap / filter / strukturelement S: $$ f \ominus S $$ Dette betyr at om alt the gule i strukturelementet legges oppå 1-ere, får pikselen 1, else 0.
Eksempel:
S = np.array([[0,1,0],[1,1,1],[0,1,0]])
f = np.array([[1,1,1,1,1,1],[1,1,1,0,0,0],[1,1,0,0,0,0],[0,0,0,1,0,0],[0,0,1,1,1,0],[0,0,0,1,0,0]])
res = erosjon(f, S)
fig, _ = plt.subplots(1, 1, figsize = (20, 6)); fig.add_subplot(1,3,1); plt.imshow(f);plt.title("f"); fig.add_subplot(1,3,2); plt.imshow(S); plt.title("S");fig.add_subplot(1,3,3); plt.imshow(res); plt.title("Resultat")
res = dilatasjon(f, S)
fig, _ = plt.subplots(1, 1, figsize = (20, 6)); fig.add_subplot(1,3,1); plt.imshow(f);plt.title("f"); fig.add_subplot(1,3,2); plt.imshow(S); plt.title("S");fig.add_subplot(1,3,3); plt.imshow(res); plt.title("Resultat")
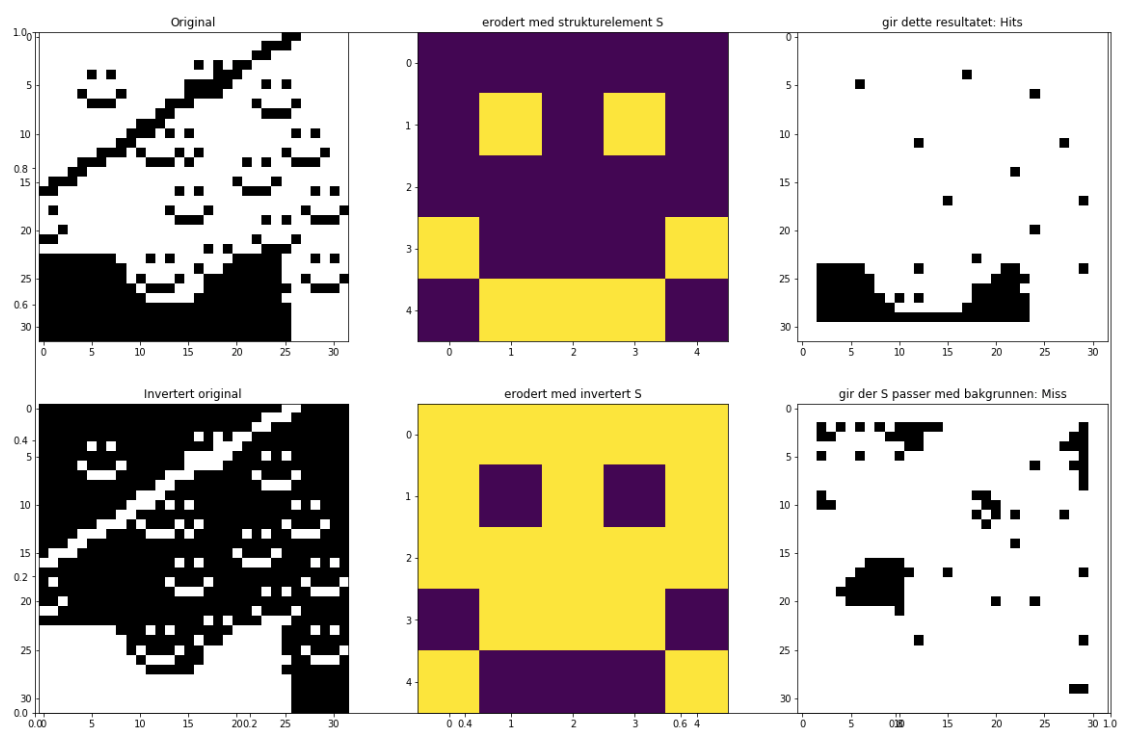
Eksempel på bruk: Hit-or-miss
Ved erosjon så vi at resultatet bare ble 1 hvis pikslene rundt så ut som strukturelementet selv. Vi kan bruke dette til å finne objekter i bildet
$$ f \circledast S = \bigg( f \ominus S_1 \bigg) \bigcap \bigg( f^C \ominus S_1 \bigg) $$

Vi kunne ikke ta alt denne gangen:
Andre operasjoner med morfologi
- Tynning
- Åpning, lukking
- Fylle ut figurer
- Kant-deteksjon